
I had a call from my customer about bad SWR on his 4O3A 20M BPF and he asked me to check the filter. This is how the story has started….
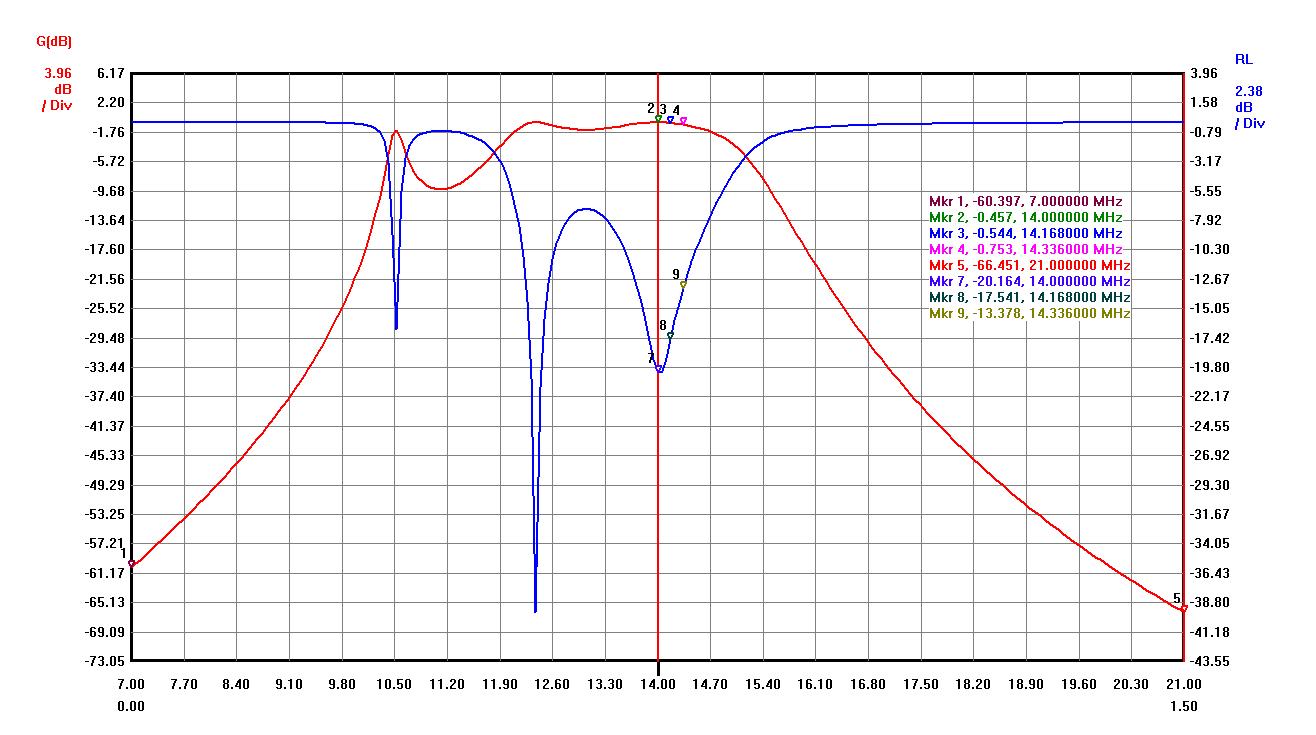
The graph below is what I measured with my VNA when I received the filter.
- Insertion Loss is from -0.45dB to -0.75dB. It is from 10% to 16% power loss in the filter. That is why my first 1500W power test made coils very hot.
- Return Loss is from 20dB to 13dB, which is SWR from 1.22 to 1.57
Something is obviously wrong with the filter shown below.
I asked if the graph from original 4O3A measurement available and it was emailed to me the next moment.
It is almost the same as my graph shown above. Nothing is wrong with parts inside, it was made with bad parameters. RL and IL are a little better but in general, it is not a well tuned filter.
- The 4O3A tuning is so sharp that any changes will ruin the filter and this happened with this particular one.
- Filter band isolation is a very easy parameter to achieve but Return Loss and Insertion Loss require a careful tuning which was not done to the 20M 4O3A filter.

The filter model was built with a filter software to understand which parts to change to align the filter.
Below is a perfect graph which was calculated with a software.

It took a few hours playing with a software to find what parts have wrong values to create the same graph shape as it was in the original filter.
- Graph below created in the software is closed by shape to the original filter condition. Now, all part values can be compared to installed parts to make all required changes.
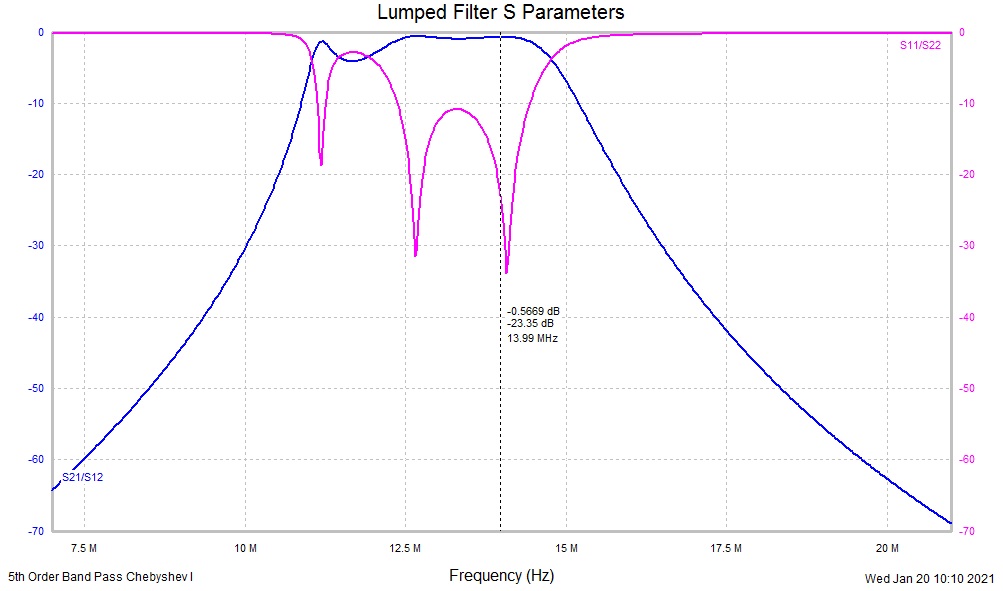
- There was no intention to rebuild filter completely.
- The goal was to make as less changes as possible.
The first try was made with all coils to adjust them for improving the filter SWR and IL numbers.
The filter below is the result of the first try. The only coils adjusted to see if it could help. It was interesting that for all of them the inductance was decreased to improve numbers. As per software calculation, that peak on a left side of the graph (red circle) caused mostly by one coil (central coil) which has a value of 40% more than it required by a software calculation.

No capacitor value changed but only coils adjusted and now, as you can see Return Loss is much better but filter is still has some problems.
- That graph (red circle) peak on the left side of the graph is not an expected graph shape and it decrease the Isolation for a lower band but because all shifted to the left, we can see that 15M band isolation is a good number.
- Return Loss (SWR) is still narrow, especially on a right side and any changes in any coil will bring SWR up to a high value.
The next step was to get rid of that graph peak to make the filter graph a good one and as close to a computer model as it is possible by changing capacitor values as well. Coil adjustments show that it is not enough and the filter graph is still far from the symmetrical shape which calculated by a computer software.
4O3A filters built with home made Teflon insulated capacitors. It is hard to know the exact value of those capacitors but using some formula it can be done with some practical approximation.
This is a website where it can be calculated. K factor is a Teflon dielectric constant which is 2.1.
A sandwich capacitor value is relatively small (110-120pF as per 4O3A design) and extra doorknob capacitors required to be added anyway.
Filter coupling coils are fixed by design. It means, it is not possible to change their inductance during the tuning procedure and only other parts can be changed around those fixed coupling coils. This make the tuning much more difficult especially with many unknown variables.
Below on a photo, you can see both a coupling coils with wire turns fixed by Teflon rods and home made Teflon insulated capacitor with added doorknob capacitors to increase a total capacitance.

Those sandwich capacitors are large in size and need some space to be installed inside the enclosure. Sandwich capacitors requires a solid thick aluminum plates tightened by two screws to make capacitor mechanically stable. The bottom of the filter enclosure is a 5mm thick aluminum plate which make the filter a heavy box.
Please, see the photo below for a comparison. VA6AM filter is 18″ long with a cooling fan installed and 4O3A is 5.5″ longer with total box length almost 24″ .

The second try to improve filter was taken. This time some capacitors were changed too.
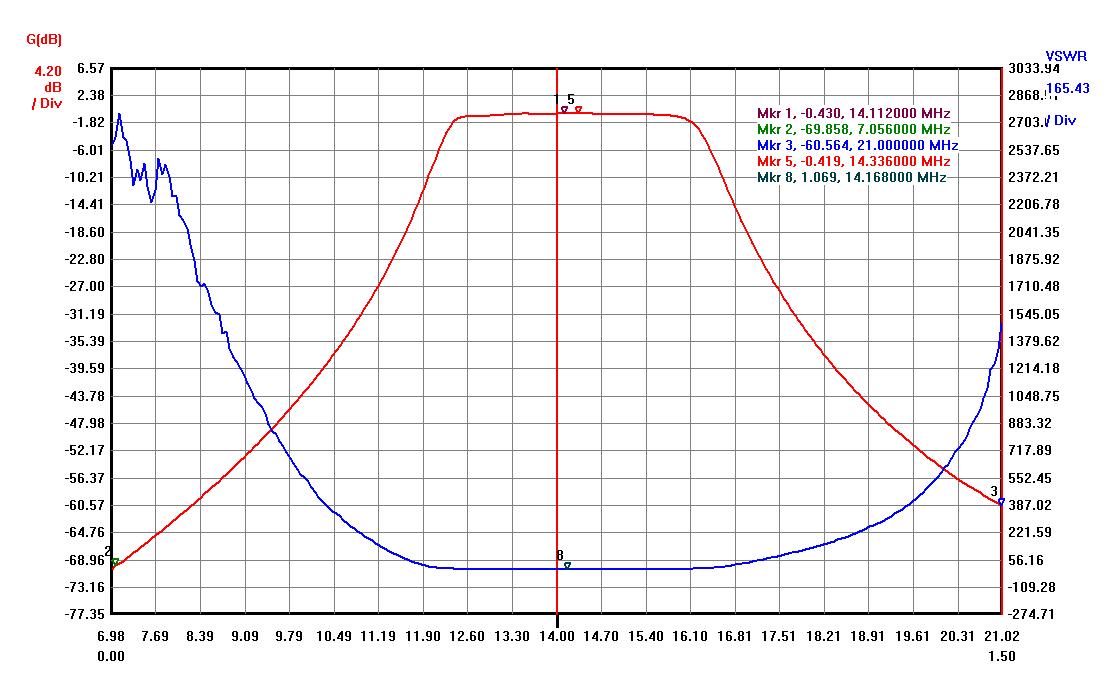
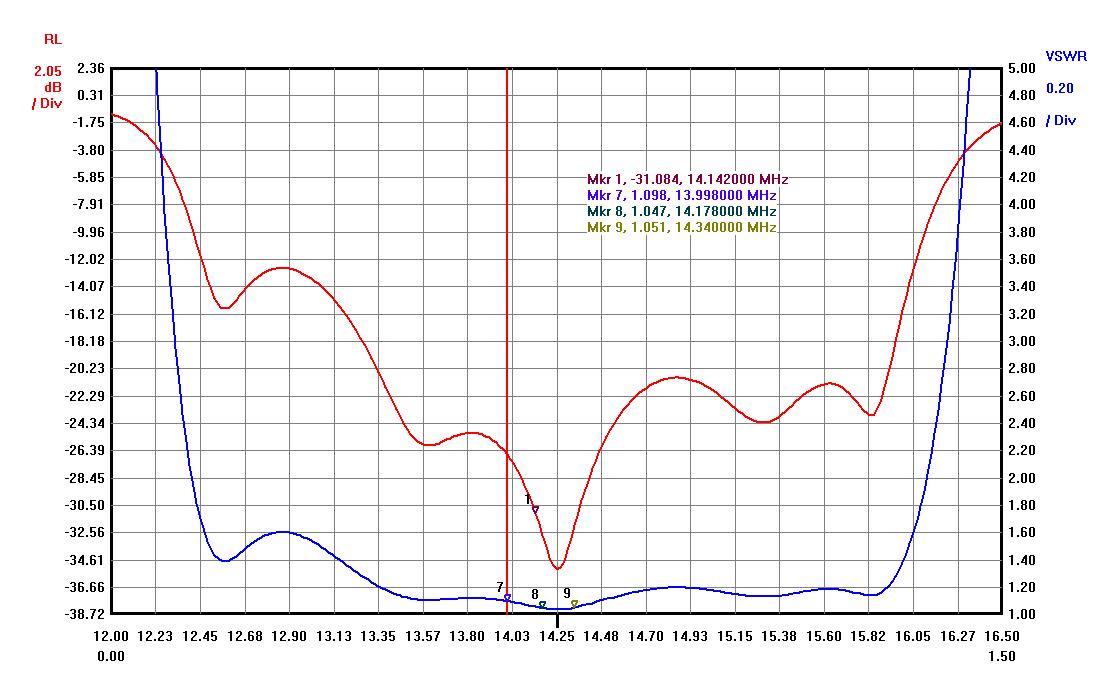
Below is a preliminary result of this second re-tuning attempt with many changes applied to the filter. Some capacitor values changed, coils changed too. The goal was to check that I am on a right way with the software calculations. Result it almost good.
Please, see below two graphs, band attenuation and SWR/Return Loss.
- SWR graph is much wider now, it is more than 2MHz wide by SWR value below 1.2. It is a good thing as it will be more stable by parameters filter.
- The filter graph is much closer to a software model shown above in this post. It is symmetrical as it should be and without any unexpected peaks.
….will be continued.
“Why are our Band Pass Filters the best in the world?” This is a statement on a 4O3A Facebook web-page.
